UK Energy in Numbers
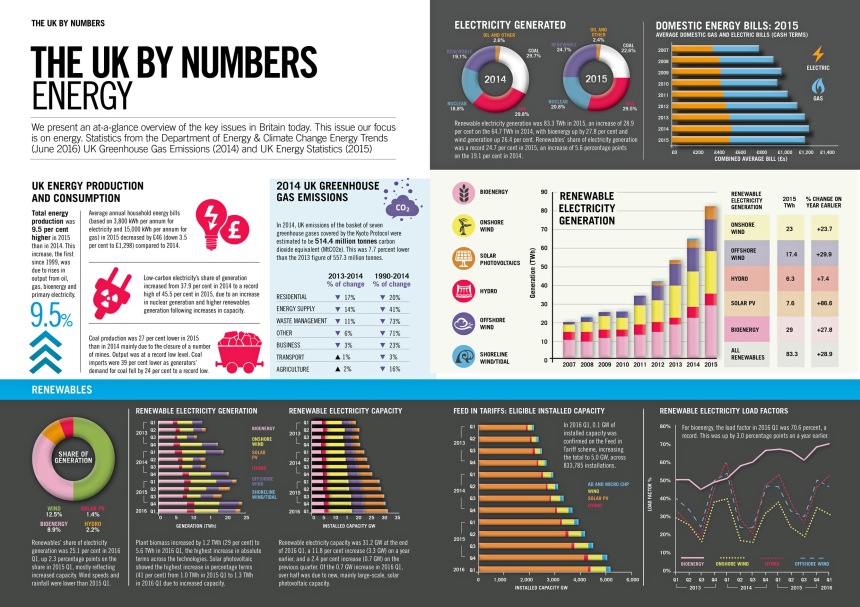
An infographic from the Economic and Social Research Council (ESRC) provides an at-a-glance overview of current trends in the UK energy system. Published in the summer 2016 edition of the ESRC’s magazine, ‘Society Now‘, statistics from the Department of Energy and Climate Change (now part of the Department for Business, Energy and Industrial Strategy) provide an insight into the challenge faced by policy-makers in the UK aiming to decarbonise the economy whilst ensuring security of supply and affordability for consumers.
Key facts include:
- Renewables generated 25.1 percent of electricity in quarter one (Q1) of 2016, up by 2.3 percentage points on the same period last year, reflecting increased capacity.
- Plant biomass experienced the highest increase in absolute terms across the technologies (onshore wind, solar photovoltaics, hydropower, offshore wind and shoreline wind/ tidal) between Q1 in 2015 and Q1 in 2016. Solar showed the highest increase in percentage terms – a 41 per cent increase over the year to Q1 2016.
- UK emissions of the basket of seven greenhouse gases covered by the Kyoto Protocol (Carbon dioxide; Methane; Nitrous oxide; Hydrofluorocarbons; Perfluorocarbons; Sulphur hexaflouride)(CO2), were 7.7 percent lower in 2014 than in 2013, at 514.4 million tonnes of carbon dioxide equivalent.
- Generators’ demand for coal fell by 24 per cent, to a record low, in 2015.
- Average household energy bills decreased by £46 between 2014 and 2015, but the cost was still on average 50 percent higher than in 2007.
The RGS-IBG and UK Energy Research Centre (UKERC) are organising a 21st Century Challenges: Policy Forum event on ‘Rescaling the UK’s Energy System‘ on Tuesday 29th November. Find out more.
‘UK by Numbers’ Credit: ESRC, Society Now. Contact Nicholas Stevens for permission to reproduce the image.


